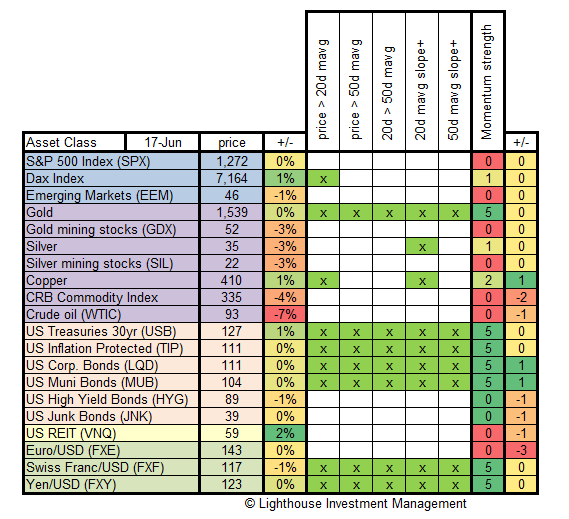
Each week we test major asset classes for the strength of their momentum. We check:
- is current price above 20-day moving average?
- is current price above 50-day moving average?
- is 20-day moving average above the 50-day moving average?
- does the 20-day moving average have a positive slope (i.e. is it rising)?
- does the 50-day moving average have a positive slope (i.e. is it rising)?
If the answer is yes, we give one point. If all conditions are fulfilled then the asset class has five points. This is considered a very strong momentum. Investors believing in strong trends would invest in assets showing a strong (positive) momentum.
We also track weekly price change (%) and the change in points.
Here is the latest table:
Observations:
- S&P 500 ended six weeks of declining prices (albeit barely; up 0.04% for the week). Momentum continues to be very weak (zero points).
- Gold is holding up extremely well, especially considering the stock market believes the Fed being in a “no-action zone”. Momentum very strong with 5 points (unchanged).
- Gold- and silver mining stocks however disappoint (again) with 3% declines (despite stable gold price). Big disconnect. Should not come as a surprise as momentum remains weak. Commodities with industrial use (oil, silver) suffer, while commodities used primarily as a store of value (gold) have so far escaped unscathed. Copper a bit of an outlier.
- Very strong momentum in fixed income (Treasuries, investment-grade, munis) except for non-investment grade (high-yield, junk).
- Further deterioration in momentum for the Euro; Swiss Franc and Yen still very strong.
Conclusion:
- Stay away from stocks, non-gold commodities, non-investment grade fixed income, be long gold, treasury bonds and Swiss Francs.
Charts can be found here:

