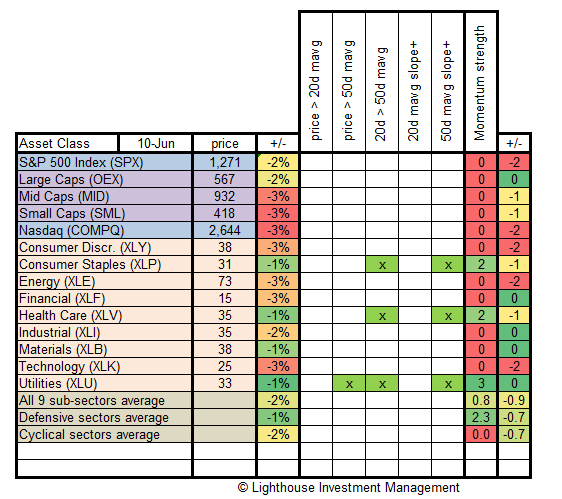
Each week we test major asset classes for the strength of their momentum. We check:
- is current price above 20-day moving average?
- is current price above 50-day moving average?
- is 20-day moving average above the 50-day moving average?
- does the 20-day moving average have a positive slope (i.e. is it rising)?
- does the 50-day moving average have a positive slope (i.e. is it rising)?
If the answer is yes, we give one point. If all conditions are fulfilled then the asset class has five points. This is considered a very strong momentum. Investors believing in strong trends would invest in assets showing a strong (positive) momentum.
We also track weekly price change (%) and the change in points.
Here is the latest table:
Observations:
- Major damage, especially in mid caps, small caps and technology stocks
- Defensive sectors outperform cyclical sectors (as to be expected)
- Financial stocks still very weak
- Momentum has been destroyed in all but 3 sectors (Consumer Staples, Health Care and Utilities)
Conclusion:
- Momentum analysis suggests to remain invested very defensively.
US stocks have declined 6 out of the last 6 weeks. The S&P 500 is approaching its 200 day moving average (1,255) and exponential 200-day moving average (1,263). It will be interesting to see if those levels can provide support.
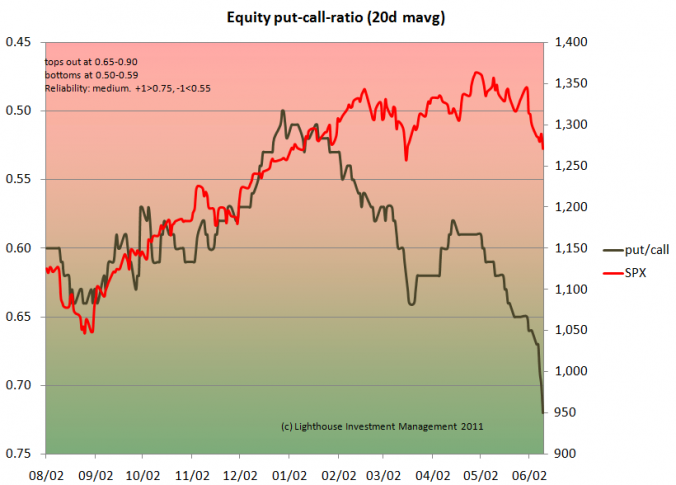
Investor sentiment is already pretty negative as measured by the equity put-call ratio:
Please not the inverse scale of the put-call ratio on the left.
However, as mentioned in previous letters to investors, negative sentiment does not mean the market cannot fall further. Many institutional investors might be bearish, but cannot raise cash ratios above a certain level (in many cases 5%), meaning they will participate in a falling market with 95% of assets. Withdrawals from their investors would trigger additional selling.


