After almost a year of gathering data we are fine-tuning the Lighthouse Investment Management Timing Indicator (LIMTI). We want to overweight constituents delivering good entry and exit signals.
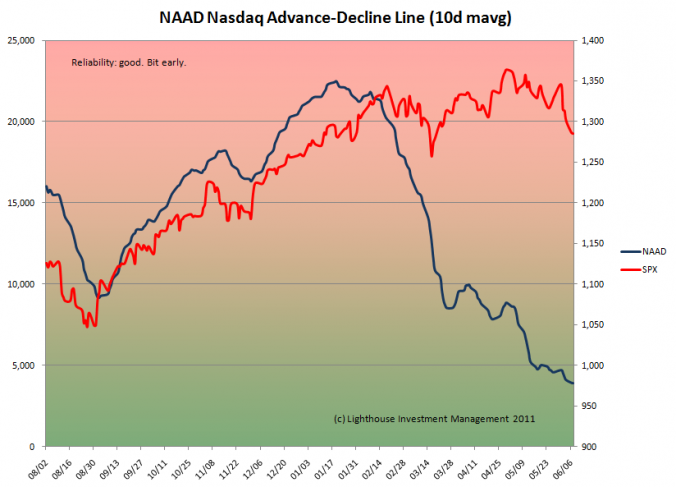
One such indicator is the Advance-Decline-Line (number of rising stocks minus number of falling stocks, cumulative over a time period). We prefer the Nasdaq (as NYSE has too many fixed-income related ETF’s that distort the picture since they might go up as the stock market moves lower).
 The NAAD gave a good entry signal in August 2010, but was too early to leave the party in January 2011. It was still a good warning flag as the market was carried higher by less and less stocks (deteriorating breadth).
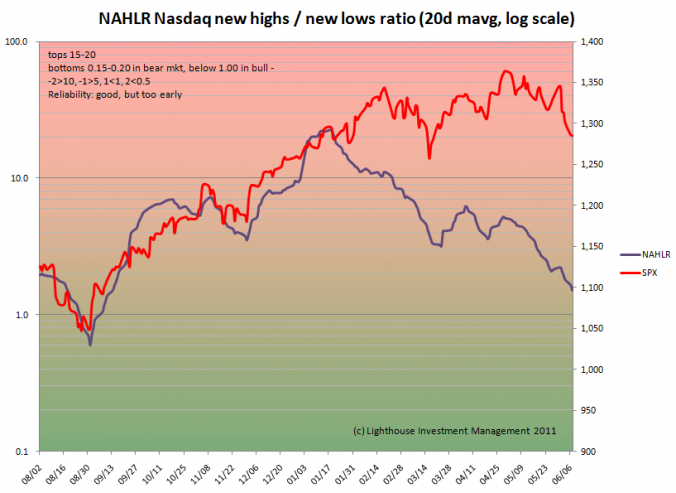
We get a similar picture if we use the ratio (NAHLr) of daily new 52-week highs and new lows. A number above means that there are more stocks trading at a 52-week high than at 52-week low. A rising trend means the momentum is getting stronger:
 Again, good entry timing, but too early on the exit.
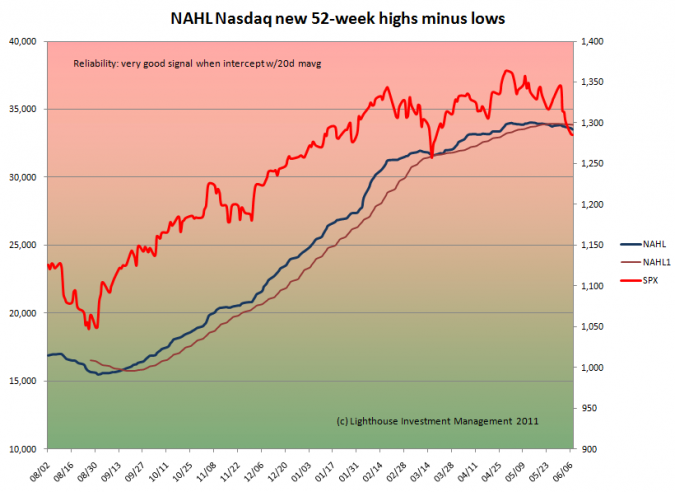
The best result can be achieved by using NAHL (Nasdaq daily 52-week new highs minus lows, cumulative, 20-day moving average) and overlaying a 20-day moving average as a trigger line:
 Entry and exit signals were timely. There was a risk of a wrong “sell” signal in March (narrowly averted).
We will overweight the NAHL signal in our overall timing indicator LIMTI. More updates to follow.
