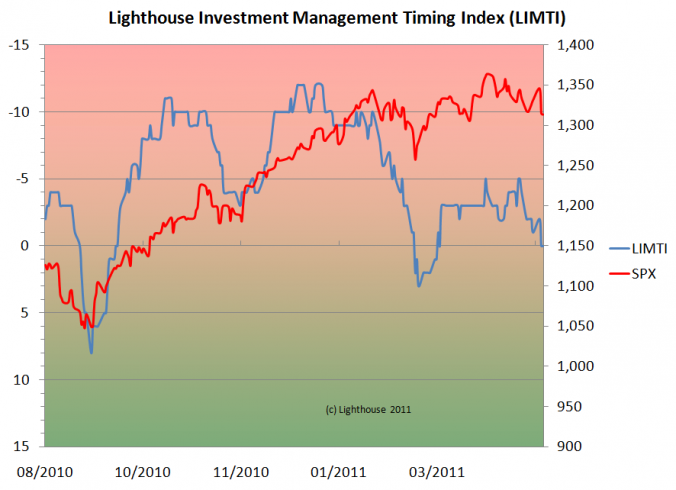
The LIMTI (Lighthouse Investment Management Timing Index) is supposed to give indications on when to buy or sell investments related to the S&P 500 index. It is made up of 10 individual indicators (for example put-call ratio, % of stocks in the S&P 500 index trading above their 50-day moving average etc). Each index is assigned values from -2 (two standard deviations or more below its mean value) to +2 (accordingly). Theoretically the index can vary from -20 (10 x -2) to +20.
As of June 2, the LIMTI shows a reading of 0, which is a slight improvement compared to last months’ -5 (scale, left, is inverted).
The Nasdaq-Advance-Decline line has failed to surpass its peaks from mid-February and beginning of April, a negative divergence. Cyclical stocks failed to make new relative highs compared to the general market. Same for small caps. Financials are in bad shape. Consumer discretionary stocks are underperforming consumer staples since mid-February, also a sign investors prefer more defensive stocks in anticipation of an economic slow-down.
The barrage of disappointing news from the economy, especially the ISM (Institute of Supply Management) and ADP (employment) figures came in well below expectations.
An elevated put-call ratio indicates investor pessimism, as do bearish readings from the AAII Investor survey. You could argue that the stock market cannot decline when most participants expect it to decline. However, as most institutional investors are prisoners of their own system (they cannot go in cash, but have to remain invested in their chosen style box), it might not matter if investors are bearish or not.

