Update on the Lighthouse Investment Management Timing Index (“LIMTI”):
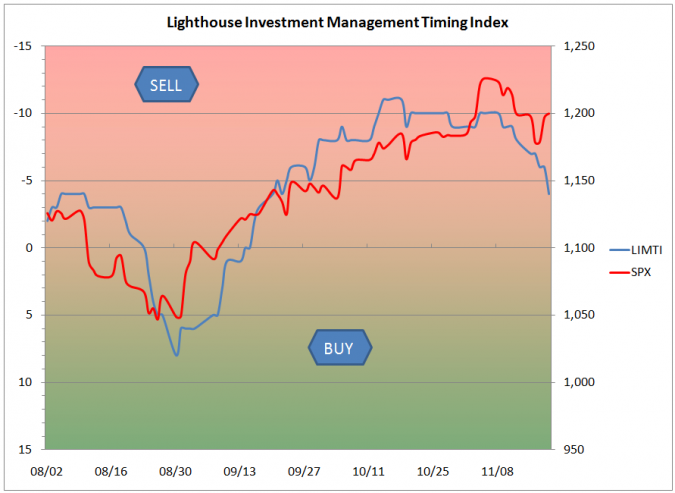
 LIMTI (Lighthouse Investment Management Timing Index) as of 11/19/2010
The LIMTI is an experimental project. The index is calculated daily on the basis of various statistical readings on the US stock market (mostly S&P 500 Index) to gauge whether the market is overbought (red shaded area) or oversold (green area).
The index “peaked” at -11 (note the inverse scale) on October 18th, slightly ahead of the peak in the S&P 500 index at 1,226 (November 5th). In the meantime, the LIMTI indicates less “overbought” conditions while still being in the territory where you would sell stocks.
Below I will go into detail in regards to which components are included in the LIMTI. I should add that all information feeding into the LIMTI is freely available on the web (we use www.indexindicators.com and www.stockcharts.com).
1. Per cent of stocks in the S&P 500 index trading above their [x] day moving average:
![per cent of S&P 500 stocks above [x] day moving average](https://www.lighthouseinvestmentmanagement.com/wp-content/uploads/2010/11/LIMTI-C0-2010-11-19-e1290372385201.png) Reasoning: mean reversion (all stocks eventually have to come back to their moving average price. A high number of shares trading above their moving average price indicates overheating).
Reasoning: mean reversion (all stocks eventually have to come back to their moving average price. A high number of shares trading above their moving average price indicates overheating).
Application: we use 3- and 5-day numbers for very short-term positioning with options. Best results have been observed with the 50-day number. Additionally, inflection points of the 50-day and the 200-day line can be used as buy or sell signals (the “50:200” indicator).
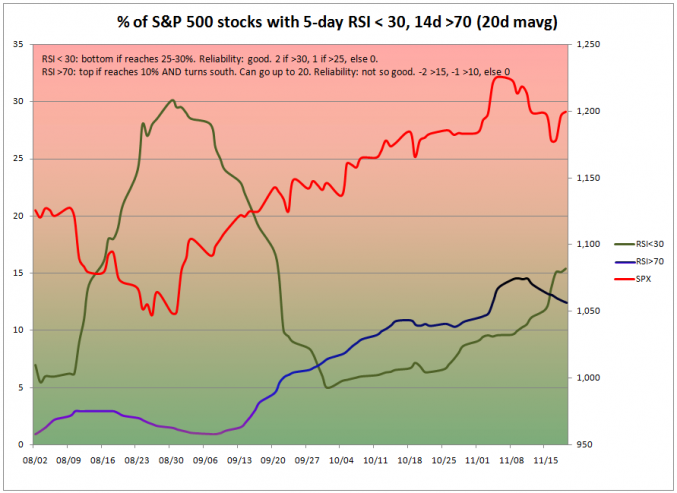
2. Relative Strength Index (RSI). In particular: per cent of stocks in S&P 500 Index with certain RSI values:
 Reasoning: RSI is a momentum oscillator measuring the speed and change of price movements (for further explanation please refer to http://stockcharts.com/help/doku.php?id=chart_school:technical_indicators:relative_strength_in). Simply put, RSI measures a stock’s average gains compared to its average losses over a certain period of time. If a stock goes up 10 days in a row, the index would be at 100 (and, accordingly, a stock declining 10 days in a row would have zero relative strength).
However, we are only interested in the overall stock market. This is why we look at the percentage of S&P 500 stocks having RSI values above 70 (for overbought conditions) and below 30 (for oversold conditions). We found that time periods of 5 days (RSI < 30) and 14 days (RSI >70) have given the best results (sell-offs are usually more severe and hence short-lived than slow but steady upwards trends).
The daily percentage values are being smoothed over 20-day periods to filter out “outliers” and false signals.
More on the remaining components of the LIMTI in a later post.
