Lakshman Achutan, ECRI (Economic Cycle Research Institute) made a recession call for the US on September 30, 2011 (and confirmed it multiple times since then).
Gary Shilling, titling his August letter “Global Recession”, says “We are already in a global recession.”
However, equity markets don’t think so, with the S&P 500 trading less than 10% away from a new all-time high. Only one side can be right. Could this be a repeat of October 2007, when the S&P 500 hit new all-time highs mere six weeks before the “Great Recession” began? Are so-called leading indicators, as used by the Conference Board, still reliable?
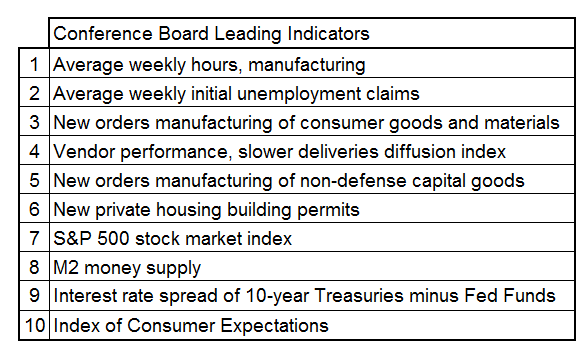
According to Mish Shedlock, these are the CB’s 10 leading indicators:
As seen above, the stock market (#7) is a terrible indicator of future economic performance. While the slope of the yield curve (#9) was a very good leading indicator in the past, it would be difficult for the yield curve to invert in the current environment. Long bond yields would have to go negative as the Fed promised near-zero interest until 2014, and possibly longer.
Usually, central bankers ‘hit the brakes’ (raise interest rates) for fear of inflation induced by strong demand and brisk economic growth. The yield curve inverts, a recession follows, and inflation recedes.
But what if the economy went into recession with short-term interest rates being near zero already (as seen, for example, in Southern Europe)?
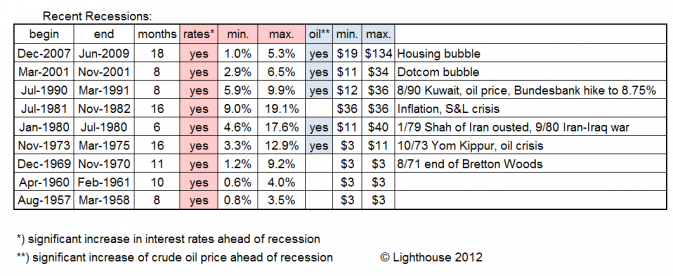
Over the past 50 years, all recessions were easily explained by central bank action and oil price shocks:
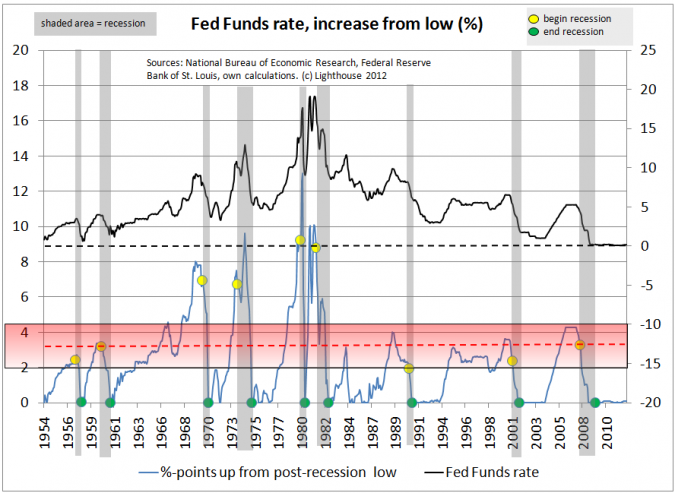
The following chart shows how the Fed increased interest rates ahead of each of the last 9 recessions. Black line: absolute level of Fed Funds rate; blue line: increase in %-points from the prior post-recession low. Right-hand scale for absolute data, left-hand scale for percentage changes (negative absolute numbers merely for better formatting):
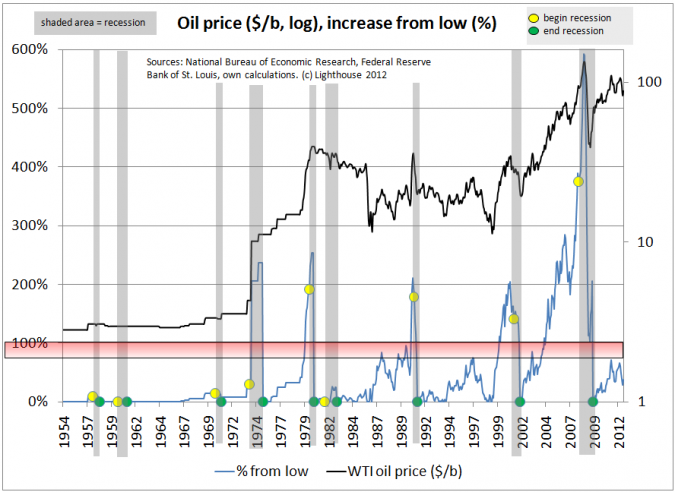
The same logic applies to the crude oil price (log scale):
I have looked at many indicators from every angle. Some have to be smoothed to cancel out short-term “noise” in order to prevent false signals (used mostly 3-months moving average). Some data do not give good signals unless you look at decline from recent peaks. Other data need to be trend adjusted (number of miles driven, for example, benefits from rising number of cars and population).
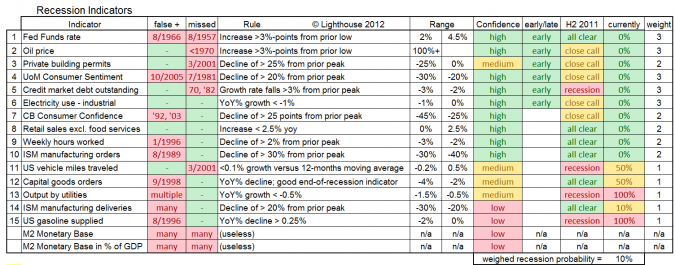
The following indicators have been tested for false positives (calling for a recession when there was none), missed recessions, the confidence I have in to work in the future, possible lead time, what it said in H2 2011, the current likelihood of a recession and the importance (1-3) I assigned to it for a weighted overall recession probability:
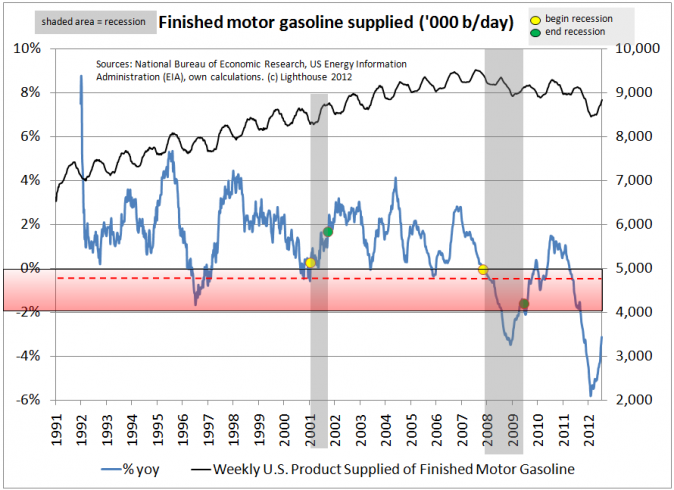
Not all recessions are equal, and no single indicator is perfect. It is therefore hard to draw the ‘trigger’ line. Set it too low, and you will miss some recessions. Position it too high, and you will get a lot of ‘false positives’ (indicator signals a recession when there is none).
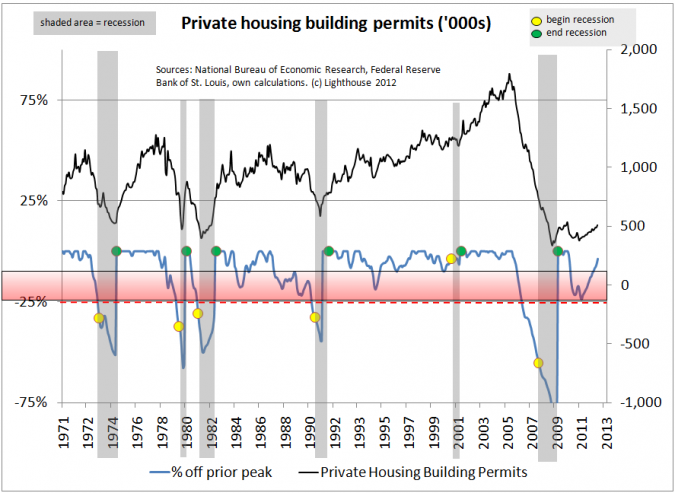
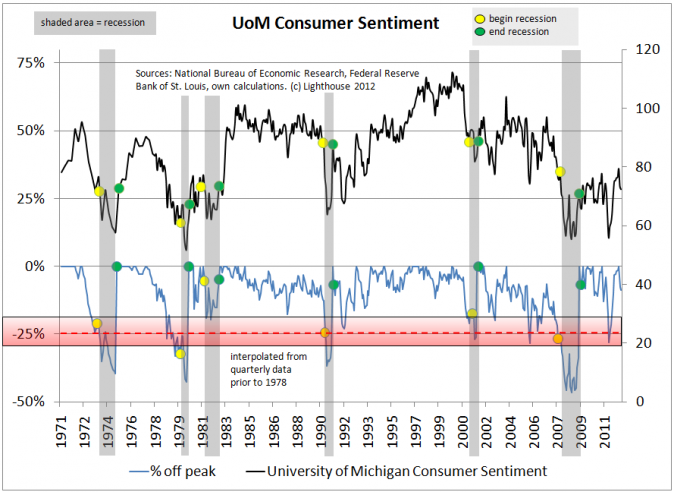
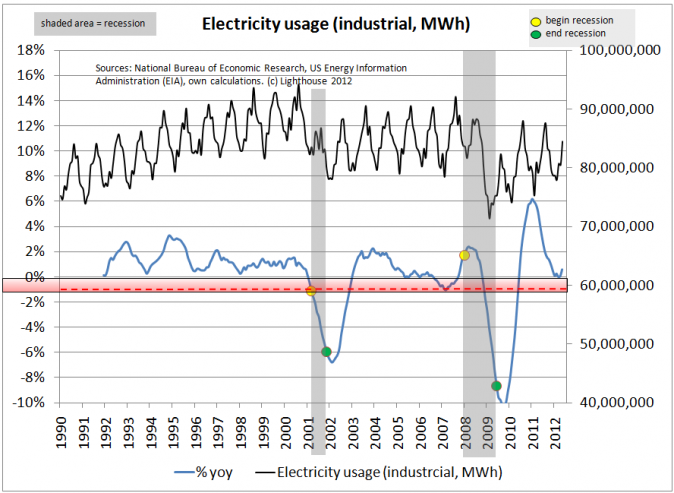
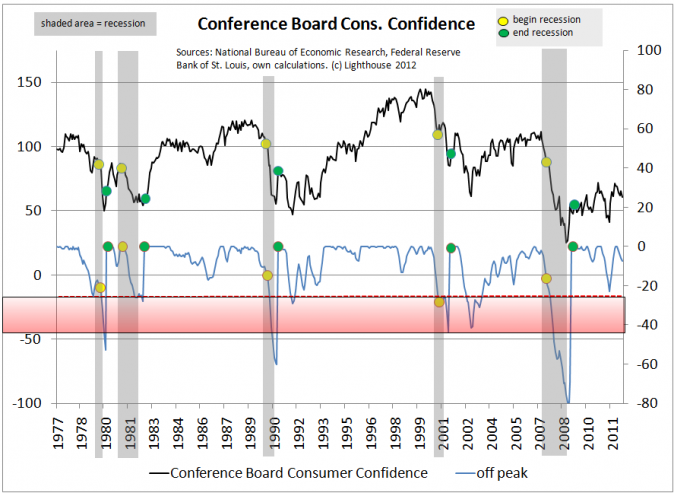
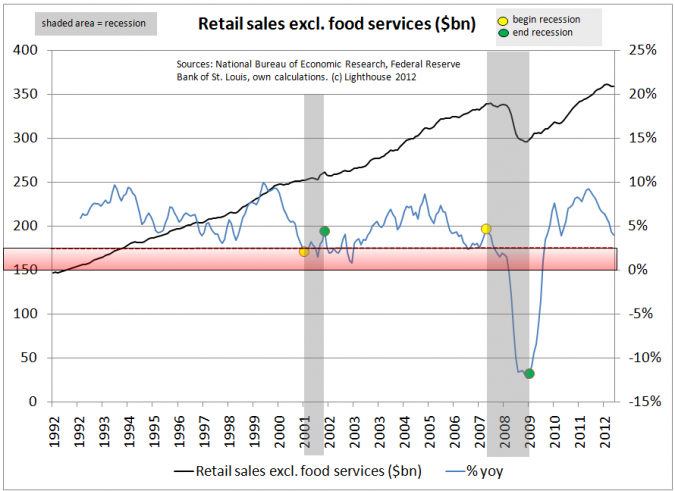
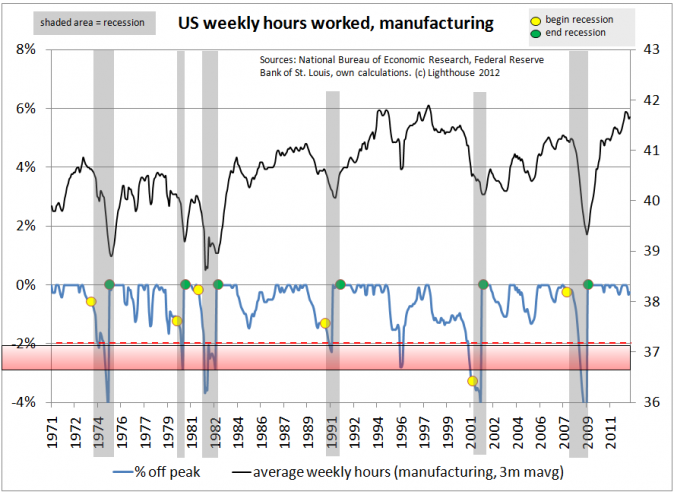
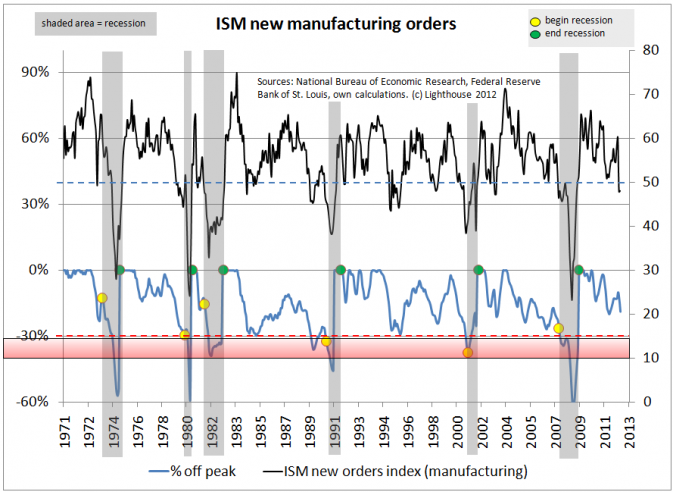
I have drawn boxes shaded in red. The upper end of the box is the highest level necessary to catch all recessions; the bottom end is the lowest setting necessary to avoid all false positives. The taller the box, the less confidence the indicator deserves. If the read-out is somewhere in between those bands, recession probabilities are assigned.
At the risk of boring you with details, here are the remaining charts:
Want to build a house? Need a permit! Any decline in permits of 25% or more from prior peak and you can bet on a recession. Missed the one in 2001 though. 2011 was a close call. Absolute level still below the lows of 1990/91 recession. Population was 250m then compared to 315m today.
UoM Consumer Sentiment: One false positive (2005), one miss (1981). 1980-82 were back-to-back recessions, so let’s not be too harsh about that. Declines of 25%+ indicate recession. 2011 was a close call, but currently out of the woods.
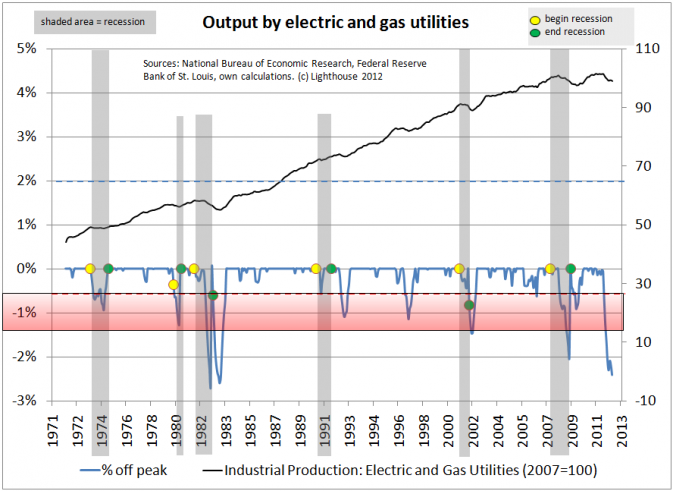
If you run a business you need electricity. Sure, weather has an impact (electricity use in the US peaks in summer due to air conditioning), but this thing seems to work. If electricity usage drops by 1% or more, it’s a recession. Limited historic data, but no misses and no false positives. Currently a close call.
The CB’s Consumer Confidence is similar to the UoM Sentiment. Two false positives (1992, 2003), but it did catch all recessions including the ones in 1981/2 and 2001 (difficult for a lot of other indicators). 2011 was a “close call”. Currently no red flag. Would have to decline to 45 to trigger recession call in 2013.
Retail sales (ex food services) fell annualized 2.7% over the three months to July. Falling retail sales for three consecutive months indicated a recession 27 out of 29 times since the data series began (1947), according to Gary Shilling. Year-over-year, the chance is still positive, but add a few weak months and the economy would be in the tank.
Before you fire employees you reduce their working hours. A drop in average weekly working hours in the manufacturing sector of 2% or more indicates a recession. Except for 1996. According to this indicator, the US economy is currently sailing smoothly.
The Institute for Supply Management (ISM) regularly asks company executives about orders, sales, inventories etc. A level of 50 indicates no net balance for participants seeing stronger and weaker business activity (economy stagnates). The current level (48) points to a slight contraction. However, the decline from prior peak is not yet large enough to raise recession alarm. One false positive (1989).
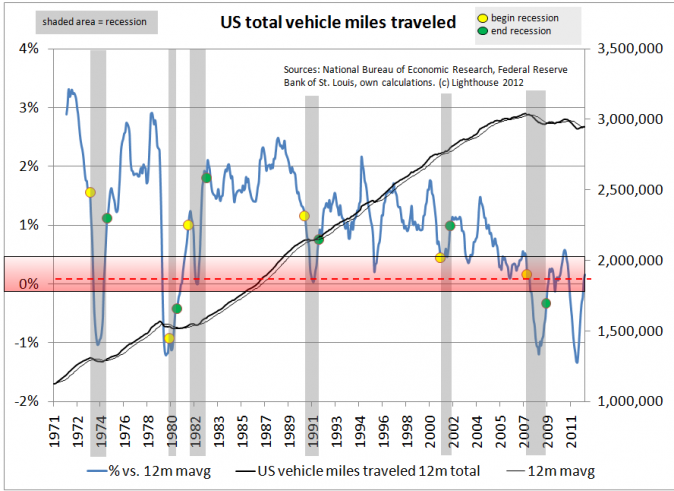
Unemployed people usually don’t drive to work. But the US population increases approximately 1% per annum, so traffic increases constantly.
If total miles driven grow less than 0.1% versus its own trend, you are likely to be in a recession.
The 2001 recession was missed. This indicator says we had a recession in 2011 (which is theoretically possible – we might not know it yet). Is the prolonged decline in miles traveled since 2007 due to online shopping? According to data from the Census Bureau, electronic shopping and mail order houses amounted for 5.9% of retail sales (ex autos) in 2004, increasing to 9.0% in 2011. However, additional trucks are needed to deliver the additional volume, partially negating fewer trips to the mall by individuals. The number of non-farm employees was approximately the same in 2011 and in 2004, eliminating reduced employment as a source of the decline.
The steep drop in 2011 is puzzling. Mish Shedlock recently looked at possible reasons for the decline in gasoline consumption.
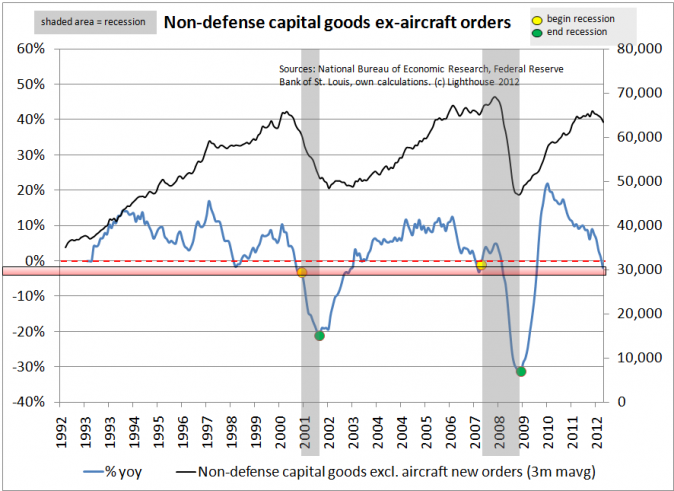
Defense and aircraft orders are lumpy and distort trends, so we exclude them here. “Medium” confidence in this indicator due to limited historic data. If you set the trigger at 0%, we had a false positive in 1998 and are currently in recession.
Electricity production should be linked to economic growth. This indicator, unfortunately, had many false positives (1983, 1992, 1997, 2006), so confidence is “medium”. Setting the trigger below -0.5% would eliminate false positives, but make you also miss 1990/91. Regardless, electricity production suggests we are in a recession as I type.
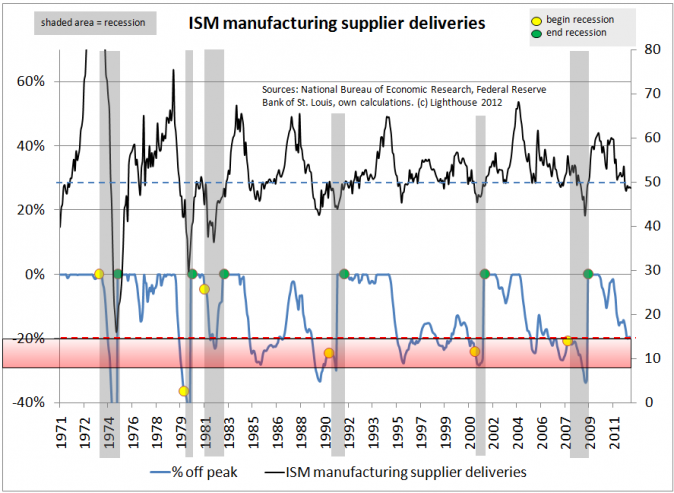
Finally, the least confident indicators. First, the ISM manufacturing supplier deliveries. The current reading of 48.7 suggests a mild contraction. Multiple false positives (1985, 1989, 1995, 1998, 2005) muddy the water.
Cars need gas, and gas needs to be delivered to gas stations. Inventory effects are unlikely because of high turnover. “Low” confidence because of false positive (1996) and limited historic data. Can the recent decline be explained by online shopping?
SUMMARY: Established leading indicators incorporate questionable input. While there is no perfect indicator, a combination of the ones tested above, weighed by accuracy, confidence and timeliness should produce a good reading.
The higher-confidence indicators say that 2011 was a “close call”, but we are currently not in a recession. However, a lot of lower-confidence indicators are showing readings consistent with a severe recession.
It is entirely possible we narrowly avoided a recession in 2011 and are heading towards another one in 2013. Currently, however, combined indicators suggest only a 10% likelihood of being in a recession at this point (September 2012).
The US economy is experiencing the slowest recovery of the past 50 years (both from an employment perspective as well as from GDP growth). After looking at total credit market debt outstanding I concluded this was due to a decline in the marginal utility of additional debt (see this post). Some readers have mistaken me for an advocate of more quantitative easing. I should have been more clear about this: I do not think printing money is an appropriate remedy for economic woes. Enabling the government to finance fiscal largess at artificially low rates is unlikely to cure problems related to excessive debt levels.
A pdf version of this post can be found at Scribd

