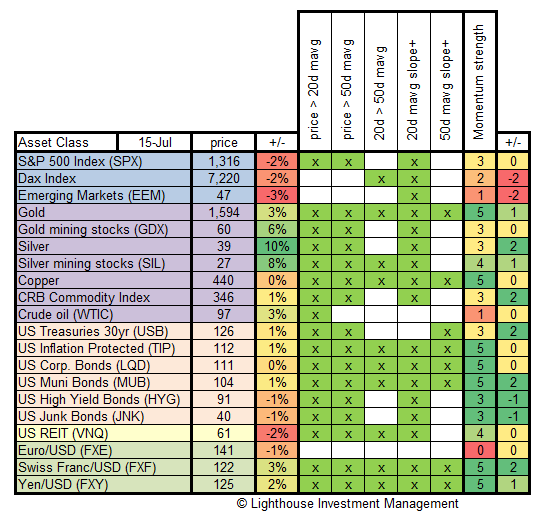
Each week we test major asset classes for the strength of their momentum. We check:
- is current price above 20-day moving average?
- is current price above 50-day moving average?
- is 20-day moving average above the 50-day moving average?
- does the 20-day moving average have a positive slope (i.e. is it rising)?
- does the 50-day moving average have a positive slope (i.e. is it rising)?
If the answer is yes, we give one point. If all conditions are fulfilled then the asset class has five points. This is considered a very strong momentum. Investors believing in strong trends would invest in assets showing a strong (positive) momentum.
We also track weekly price change (%) and the change in points.
Here is the latest table:
Observations:
- Huge discrepancy in performance between stocks (down 2-3%) and precious metals (up 3-10%). Precious metals driven by Fed Chairman Bernanke’s hint at further money printing.
- Risky fixed income (high yield, junk) fared worse than “risk-free” (Treasuries, TIPS).
- Euro lost further ground, while Swiss Franc/USD reached a new high.
- Momentum deteriorated for stocks, while improving for most commodities and treasuries as well as Swiss Francs and Yen.
Conclusion:
- A momentum-oriented investor would invest in Treasury bonds, Swiss Franc and Gold. The Euro, Oil, and emerging market stocks should be avoided.
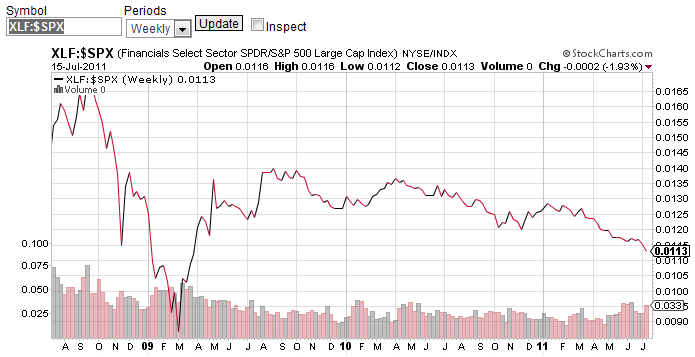
I also would like to point out the continued bad performance of the financial sector (here relative to the S&P 500 Index):


